
If you’re unsure about data visualisation and what it can do for your business, read on.
There’s a lot of buzz surrounding the word “data” and that’s perfectly understandable considering that today’s equivalent of gold is data. Unsurprisingly, many companies have realised its value and begun monetizing it in many ways. One such method is called data visualization or dataviz.
Simply put, dataviz is the visualization of a set of information. Every graph, chart, infographic, map, video, slideshow that you’ve seen is a form of it. The first ever type of modern dataviz first appeared in the 1600’s by William Playfair. He created what would widely be used by educational institutes all over the world – bar chart.
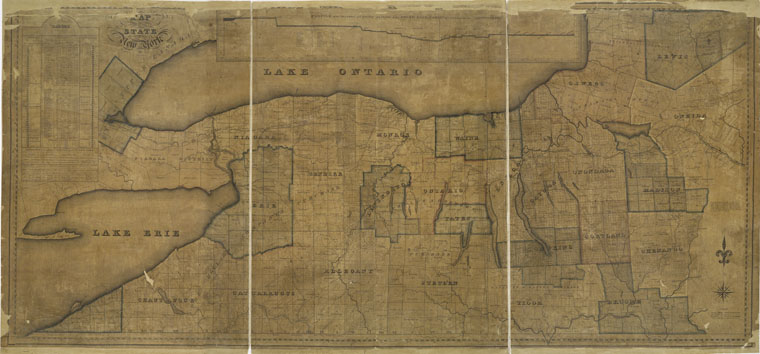
Maps are one of the oldest forms of visualized data.
In the early 90’s, dataviz was commonly presented in the form of Excel sheets or PowerPoint slides. Though these forms did make information more easily digestible, they were certainly not the best. The presentation of the data was either too complex or too dull for the viewers to capture what the data was trying to convey.
Two researchers from the Pompeu Fabra University in Barcelona conducted a study in 2012 titled “The Illusion of Predictability”. The researchers gathered three different groups of economists and gave them the same question about a dataset with a minor variation. Group A was given a data and a statistical analysis of that data. Group B was given the same as well as graph. Group C was given only the graph. Here’s where the power of data visualization really kicks in. 72% of the economists in Group A answered wrongly meanwhile in Group B it was 61%. But only 3% of the economists gave the wrong answer from Group C.
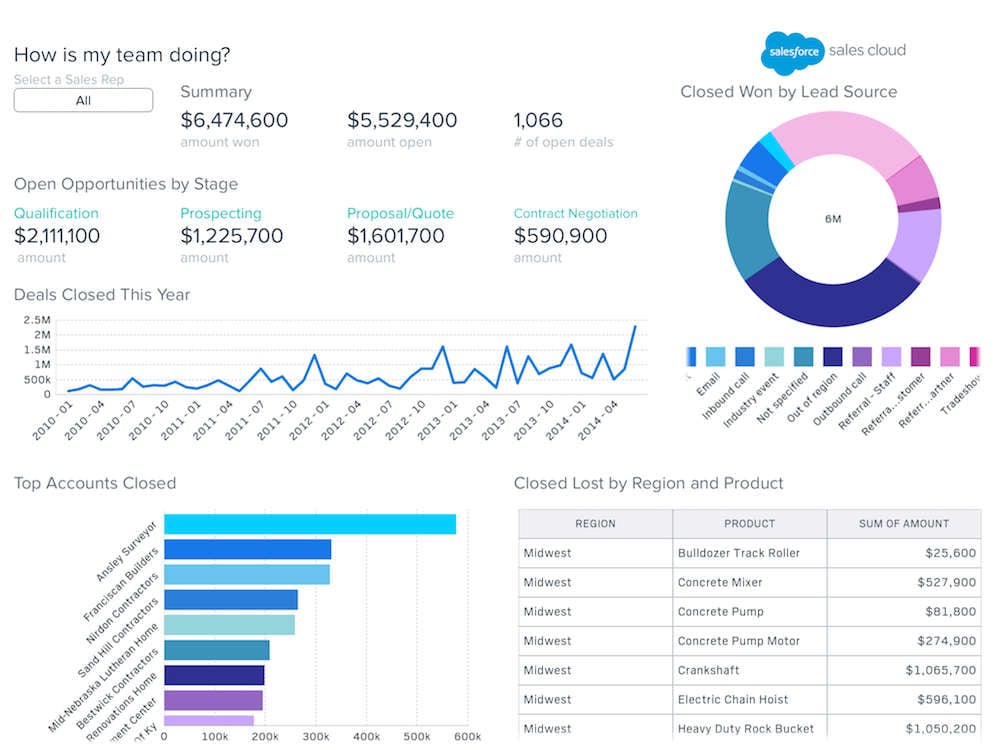
Salesforce’s Wave Analytics displays all the data about your various teams and clients in a simplified way.
Today, presenting information is key to driving the sales of any company and your audiences are no longer limited to just the board of directors or investors. Services such as Salesforce incorporates data visualization using Wave Analytics to change the way businesses operate not just internally but externally as well.
With the advent of social media, every netizen is now an audience and a possible client. So the better your dataviz are, the further your sales reach go.
Lava is an authorised Cloud Partner of Google and is a reseller of G Suite (previously known as Google Apps, Google Maps for Work, and Google Cloud Platform) in Malaysia. With more than a decade of experience in the industry, we’re proud to say we’re one of the leading cloud consultants and service providers in the Asia Pacific region.